Unlocking Efficiency in Workloads: The Revolutionary Insights of Campaign Diagrams
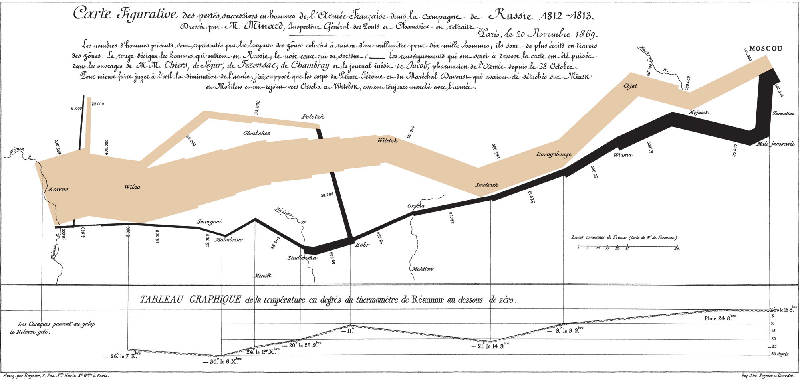
In a groundbreaking approach to workload analysis, researchers at the University of California, Davis, and NVIDIA have introduced a novel visualization technique known as campaign diagrams. This innovative method combines multiple performance metrics into a single coherent view, allowing for a deeper understanding of resource utilization and bottlenecks in modern computing tasks.
The Challenge with Traditional Visualizations
Performance analysis has long relied on models like rooflines, which provide a high-level view of resource limits and bottlenecks by plotting compute throughput against operational intensity. However, these methods often oversimplify the execution phases of a workload by collapsing them into a single point, thus losing critical time-based insights. Fine-grained profilers expose detailed operations, but they do not easily reveal which components are limiting performance.
Introducing Campaign Diagrams
Inspired by Charles Minard's famous visualization of Napoleon’s Russian campaign, campaign diagrams present a more nuanced narrative of workload phases. By illustrating metrics such as memory bandwidth utilization, compute throughput, and execution time over the duration of the workload, this new technique enables developers to pinpoint where optimizations can be most effectively applied.
Unlike traditional models, campaign diagrams provide a phase-level breakdown that reveals individual portions of a computational workload, showcasing when resources are underutilized or over-subscribed. This enhanced visibility is crucial for identifying optimization opportunities that can lead to significant performance improvements.
Key Findings from Case Studies
Two case studies highlighted in the research demonstrate the effectiveness of campaign diagrams. The first case involved a low-rank matrix multiplication (GEMM), revealing that reducing operational intensity could counterintuitively improve overall performance by optimizing computation and memory usage. The second case focused on a workload called Mamba, where the diagrams uncovered opportunities for both fusion (combining execution phases) and pipelining (executing phases concurrently), thus streamlining memory and processing requirements for significant performance gains.
Optimizations Unveiled
By providing a comprehensive view of performance metrics, campaign diagrams help engineers and researchers make informed decisions about workload design and architecture. Key optimization strategies include:
- Pipelining: Overlapping execution phases to enhance resource utilization.
- Dilation: Stretching the duration of phases to avoid resource contention.
- Throttling: Adjusting execution speeds to keep resource demands within limits.
The effectiveness of these strategies is made clear through campaign diagrams, which visually represent potential optimizations over time, leading to superior computational efficiency in various workflows.
Implications for Future Workload Design
The introduction of campaign diagrams promises to change how researchers and developers approach performance optimization in complex computing systems. By allowing for real-time analysis and recommendations on workload design, this technique stands to enhance the overall efficacy of resource utilization in modern hardware architectures.
As workloads grow increasingly complex, tools like campaign diagrams will be invaluable in navigating the intricate trade-offs that define modern computational efficiency. This innovative visualization method has the potential to significantly influence future developments in both theoretical and applied computing.
Authors: Toluwanimi O. Odemuyiwa, John D. Owens, Michael Pellauer, Joel S. Emer